



How Should Dust Holding Capacity Be Compared Fairly?
A fair comparison of filter media dust holding capacity begins by treating the result as a test outcome under stated conditions, not as a universal material property. A media sample that retains a large mass of dust in one test may show a lower value under a different airflow, particle distribution, terminal pressure drop, or efficiency requirement. The useful question is therefore: how much contaminant does the complete filter retain before reaching its allowable resistance, while maintaining the required downstream cleanliness?
Comparing only a single dust holding capacity figure can lead to the wrong selection. A low-efficiency medium may admit a meaningful portion of fine dust downstream and appear to load slowly. A denser, more efficient medium may capture that same fine fraction, develop pressure drop sooner, and report a different loading result. Neither outcome can be interpreted fairly without the rest of the performance picture.
Start with an identical test basis
Dust holding capacity is normally expressed as the amount of test dust retained when a defined final pressure drop is reached. For two values to be comparable, the underlying test conditions need to match closely. The most important items are the test method, dust formulation, particle-size distribution, face velocity or airflow, initial resistance, terminal resistance, and measured filtration efficiency.
A stated result is incomplete when it does not identify whether the test used a flat-media specimen, a pleated filter element, or a finished filter assembly. Flat-sheet data helps compare media behavior, but it does not predict final element capacity by itself. Pleat geometry, effective media area, spacing, support layers, seal design, and flow distribution all alter how contaminants accumulate in the installed product.
The terminal pressure drop deserves particular attention. If one material is tested until a substantially higher final resistance than another, its reported dust holding capacity will usually look higher because it was allowed to remain in service longer. That does not establish that it offers lower energy consumption, better protection, or a more suitable replacement interval. A fair comparison uses the same terminal pressure drop, or presents the full pressure-drop-versus-dust-load curve so that results can be read at the same operating point.
Dust type can reverse the apparent ranking
Test dust is not a neutral detail. Coarse, irregular particles tend to form a relatively open surface layer. Fine particles can penetrate farther into a fibrous structure, block internal flow passages, or form a compact cake. Media that performs well with one dust challenge may behave quite differently with another.
This matters because common service environments rarely resemble a single laboratory dust exactly. Gas turbine intake filtration can encounter mineral dust, salt-containing aerosols, fibers, biological matter, and moisture-related deposits. Automotive air filtration may see road dust, soot, tire-derived particles, and pollen. Semiconductor and biopharmaceutical environments often place greater weight on fine-particle control, low shedding, and stable behavior under tightly managed air conditions. A test dust should be relevant to the intended contamination mechanism, while still allowing repeatable comparison.
Particle-size distribution is especially important. A dust blend dominated by larger particles often favors media with high void volume and surface-loading behavior. A blend with a strong fine fraction places more emphasis on depth capture, fiber diameter, electrostatic effects, and the resistance increase caused by pore restriction. Reporting the total retained mass without describing the dust challenge conceals this difference.
Surface loading and depth loading are not interchangeable
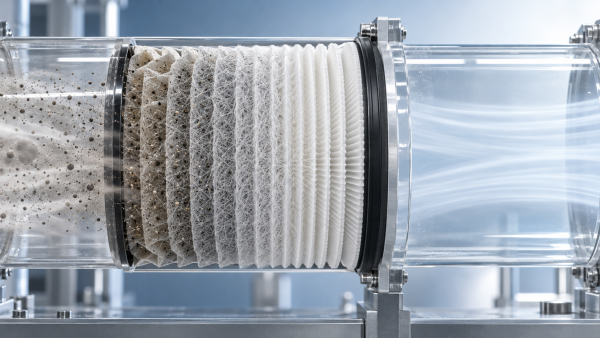
Some filter media collect much of the contaminant near the upstream surface. As the dust layer builds, that layer can improve capture efficiency but also raise pressure drop. Other media distribute particles through part of the thickness before a surface cake becomes dominant. These patterns influence both capacity and resistance growth.
Depth loading is not automatically preferable. If particles penetrate too deeply, resistance may rise rapidly because internal pores become blocked where they are difficult to use efficiently. Surface loading is not automatically undesirable either; a stable, porous dust cake can produce predictable loading behavior. The relevant comparison is the shape of the loading curve and the retained particle size range, rather than an assumption based on where dust appears to collect.
Read dust holding capacity together with efficiency
A media comparison is only meaningful when the required filtration efficiency is held constant or explicitly adjusted for. Consider two materials exposed to the same dust aerosol. One captures a larger share of fine particles from the beginning, while the other lets more fine material pass. If both reach the same final pressure drop after retaining similar total dust mass, their protective performance is still different. The downstream system sees different contaminant loads.
Initial efficiency alone is not enough. Some media rely partly on electrostatic attraction, which can produce strong early capture of fine particles with low initial resistance. As loading progresses, charge effects may change, while mechanical capture and the developing dust layer take on a larger role. A single efficiency reading at the beginning of the test does not reveal how efficiency evolves through the service interval.
For sensitive applications, compare efficiency at defined particle sizes and at multiple loading stages. At minimum, the data should clarify whether the quoted efficiency represents initial, conditioned, or final performance. A capacity result paired only with a broad efficiency label leaves too much room for mismatched interpretation.
Normalize the result before making a material decision
Total retained dust mass is useful for a completed filter, but it can mislead when comparing different sample sizes or element designs. Media-level results are often normalized by area, while filter-level results may be considered per element or at a specified airflow. Each expression answers a different question.
Capacity per unit area supports material screening when samples have the same construction and test conditions. Capacity per filter helps estimate service interval for an established element design. Neither should be converted casually into the other. A pleated element does not use every square unit of media equally: restricted inlet geometry, uneven pleat gaps, local turbulence, and deformation under load can leave some media area underutilized.
Air-to-media ratio is another useful context value. Two filters handling the same volumetric flow can have very different face velocities if their effective media areas differ. The filter with more active area may show lower initial resistance and a slower pressure-rise rate, even when both use the same base medium. That is an element design advantage, not necessarily evidence that the material itself has greater intrinsic dust capacity.
Use the full loading curve when available
A graph of pressure drop against retained dust often communicates more than a final number. It reveals whether resistance rises steadily, remains moderate before a late increase, or climbs sharply after early loading. These shapes point to different mechanisms.
A steep early rise may indicate restricted pore volume, excessive local velocity, insufficient media area, compacting dust, or a support construction that limits airflow. A delayed but abrupt rise near the end of the test can reflect the formation of a dense surface cake. A relatively smooth curve does not automatically mean superior performance, but it offers a more predictable basis for setting changeout limits.
Where downstream particle control matters, add efficiency data to the same loading stages. Pressure drop and efficiency should be interpreted as a pair. A material that maintains low resistance by passing the particle fraction that matters most to the application is not solving the filtration problem.
Account for real operating conditions without replacing laboratory comparison
Laboratory testing provides repeatability. Field conditions provide relevance. Both are needed, but they should not be mixed into an unsupported direct comparison. Service dust can contain moisture, oil mist, fibers, combustion residues, or salts that change adhesion and cake structure. Humidity may soften hygroscopic particles, while liquid aerosols can cause coalescence, pore blockage, or loss of structural stiffness. Vibration and flow cycling can redistribute accumulated dust within an element.
For this reason, a laboratory dust holding capacity should be treated as a controlled ranking under a specified challenge. It should not be converted directly into a promised replacement interval. A filter exposed to coarse, dry dust may accumulate mass efficiently with a manageable pressure rise. The same filter in a mixed aerosol environment may experience a faster increase in resistance even at a lower retained mass.
Installation conditions also affect the practical result. Bypass paths around an improperly sealed filter reduce apparent loading on the media while allowing contamination downstream. Damaged pleats, compression at the frame, and poor support alignment create nonuniform flow. The measured service life of that assembly then says little about the capacity of an intact, correctly installed element.
Separate media behavior from filter construction
When evaluating alternative materials, first determine whether the question concerns base media or the finished filter. For base media, compare fiber structure, thickness, basis weight, permeability, tensile behavior, initial resistance, efficiency, and loading curve under an aligned test. Layered constructions need further clarification: a prefilter layer, fine-fiber capture layer, substrate, scrim, or adhesive pattern may each change the way dust enters and occupies the structure.
Lamination method can matter when it affects open area, stiffness, solvent compatibility, or resistance to delamination under airflow and loading. Bonding that migrates into the active filtration zone can reduce permeability. An overly flexible composite may change pleat spacing under pressure, while an excessively rigid construction may crack or form persistent flow channels during conversion. These effects are often absent from a small flat-sheet test but become important after pleating and assembly.
For finished filters, use the intended dimensions, airflow, orientation, housing arrangement, and final resistance limit. Comparing one deep-pleat design with one compact panel design by total grams of retained dust alone is rarely informative. The available dust storage volume and the way air reaches the media are fundamentally different.
Questions that expose an unfair comparison
- Was the same test dust used, including its particle-size distribution and feed rate?
- Did both samples operate at the same face velocity, rather than merely the same total airflow?
- Is the reported value based on the same final pressure drop?
- Were efficiency measurements taken at comparable particle sizes and loading stages?
- Does the result describe flat media, a pleated pack, or a complete sealed filter?
- Were both samples conditioned in the same way before testing, especially where electrostatic media or moisture-sensitive materials are involved?
- Does the result include the pressure-drop curve, or only the final retained mass?
A comparison remains defensible when the test basis is visible and the intended application is used to interpret it. Dust holding capacity then becomes a useful selection parameter: one that is read alongside resistance growth, particle retention, media structure, and finished-filter design rather than treated as an isolated headline figure.
Recommendation
 Oct 10, 2026
How Can Air Filter Media Increase Dust Holding Capacity Without Higher Pressure Drop?
Which liquid filter media is suitable for hydraulic oil fine-particle filtration? Discover how advanced air filter media increases dust holding capacity with low pressure drop.- Oct 10, 2026
Which Liquid Filter Media Is Suitable for Fine Hydraulic Oil Filtration?
Can synthetic filter media replace glass fiber in high-humidity gas turbine intakes? Explore media choices for fine hydraulic oil filtration, balancing efficiency, moisture resistance, pressure drop, and service life. - Oct 10, 2026
Can Synthetic Filter Media Replace Glass Fiber in Humid Turbine Intakes?
Is ePTFE filter media suitable for pulse-cleaned construction equipment air filters? Explore synthetic vs. glass fiber performance in humid turbine intakes.