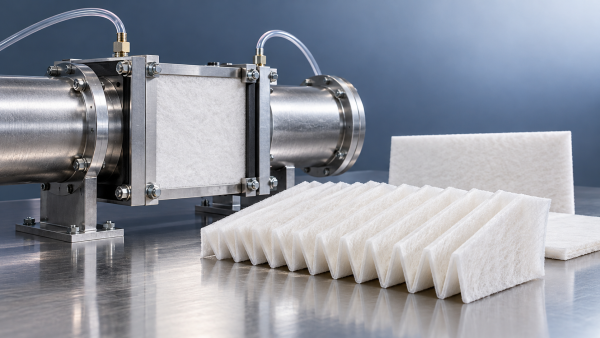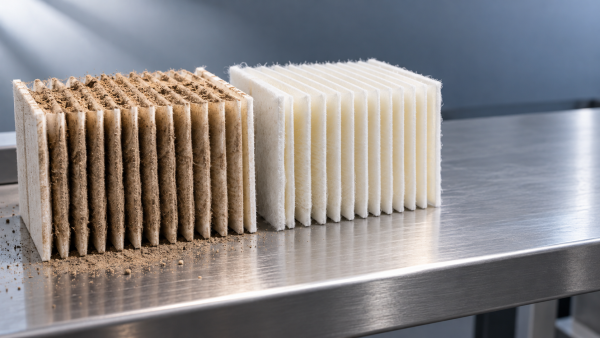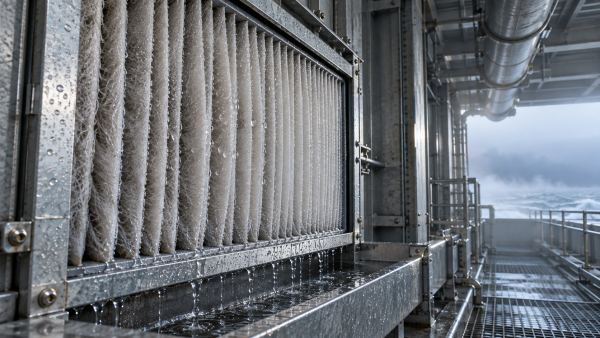




How engine air intake filter media affects initial restriction
Initial restriction is a critical screening parameter for Engine Air Intake Filter Media, but lower pressure drop alone does not establish better overall filtration performance.
Fiber diameter, pore structure, basis weight, thickness, and lamination design influence airflow resistance. Each must be assessed alongside filtration efficiency, dust capacity, and structural durability.
For technical evaluators, the priority is separating material effects from test conditions and filter geometry, then identifying which construction meets airflow and engine protection requirements.
What does initial restriction actually tell you?
Initial restriction describes the pressure loss across a clean filter or media specimen at a specified airflow, before deliberate dust loading begins during testing.
At the media level, it reflects resistance through the porous structure. At the assembly level, it also includes effects from pleats, supports, seals, and housing.
Consequently, two suppliers can report different restriction values for identical materials if their exposed areas, airflow rates, conditioning procedures, or measurement arrangements differ materially.
A useful specification therefore states pressure drop together with airflow or face velocity, specimen area, environmental conditions, and whether testing covers media or complete elements.
Lower initial restriction can preserve more of the allowable restriction budget for dust loading, provided filtration efficiency and subsequent loading behavior remain acceptable in service.
However, a material that passes more particles may appear attractive on clean resistance alone. Engine protection requires evaluating that apparent advantage against particle capture performance.
Compare media at the same face velocity first
Face velocity is volumetric airflow divided by exposed media area. It provides the essential reference for comparing resistance measurements across different sample sizes and constructions.
For example, doubling airflow through an unchanged specimen doubles face velocity. The resulting pressure increase does not demonstrate that the underlying material has become less permeable.
For approximately laminar flow through clean porous media, Darcy’s relationship provides a useful interpretation: pressure drop increases with air viscosity, thickness, and face velocity.
Pressure drop also increases as permeability decreases. This relationship is an approximation; actual filter structures may depart from linear behavior as operating conditions change.
Request a pressure drop curve across the intended operating range. A single measurement can hide differences that become significant near maximum engine airflow demand.
Air permeability data remain useful, but only when the test pressure differential, exposed area, measurement standard, and conditioning procedure are clearly identified for comparison.
A supplier’s permeability number should not be treated as a finished element restriction value. Converting between them requires additional information about geometry and operating conditions.
Which fiber and pore characteristics control clean resistance?
Smaller fibers generally provide more collection surface within a given volume, supporting particle capture. They can also increase airflow resistance when other structural variables remain comparable.
The outcome depends on fiber packing, orientation, diameter distribution, and bonding. Fiber diameter alone cannot reliably predict either pressure drop or efficiency across different formulations.
Larger, better connected flow passages generally reduce resistance. Narrow constrictions and winding pathways increase resistance, even when two materials have similar overall void volume.
This explains why average pore size and porosity are insufficient selection criteria. Neither fully describes how air travels through the entire thickness of a material.
A broad pore distribution can combine open flow channels with locally dense regions. Depending on construction, this may produce uneven airflow and inconsistent particle capture.
Ask suppliers to explain how their structural measurements relate to measured efficiency and resistance. Microscopy and pore characterization support interpretation but cannot replace filtration testing.
Where electrostatic capture contributes to efficiency, assess its stability under relevant humidity, temperature, and contaminant exposure. Low resistance should remain compatible with dependable protection.
Why basis weight and thickness must be evaluated together
Increasing basis weight often adds fibers and raises resistance when the manufacturing process produces a denser structure. The relationship is not universal across different media.
A heavier material can remain relatively open if its additional mass creates thickness instead of tighter packing. Its filtration and dust storage behavior may differ substantially.
Thickness extends the airflow path, which can increase resistance. However, a thicker structure with greater permeability may outperform a thinner, more densely packed alternative.
Compare basis weight, thickness, and calculated apparent density together. Specify the thickness measurement method because applied measurement pressure can compress soft materials and alter results.
Compression during conversion can also change permeability. Pleating, handling, and assembly pressure may reduce pore volume or distort structures that performed well as flat specimens.
Technical approval should therefore consider the material after representative processing. Clean resistance measured before conversion may not capture the behavior of the installed filter element.
Can gradient structures and laminates reduce the tradeoff?
A gradient structure distributes capture functions through the material thickness. A more open upstream region can admit airflow while supporting progressive particle collection deeper inside.
Whether this reduces initial restriction depends on the complete construction. Adding layers or increasing density can offset benefits associated with a more open upstream structure.
Likewise, a fine filtration layer may provide strong capture performance with limited thickness, while a supporting layer supplies stiffness, pleat stability, and handling strength.
Every supporting component still contributes resistance. Scrims, carrier webs, and protective layers should be included when evaluating the laminate supplied for production and conversion.
Adhesive coverage also matters. Bonding patterns can obstruct passages or create dense regions, while insufficient bonding may compromise durability during pleating, vibration, or service.
PUR, hot-melt, spray, and ultrasonic lamination processes create different bonding arrangements. Their suitability depends on materials, coverage, process settings, and required mechanical performance targets.
Request resistance and efficiency results for the finished laminate. Data from its individual layers cannot fully describe interactions introduced by bonding and subsequent processing.
Why a better media sample can produce a worse filter
Finished filter restriction depends strongly on usable media area. Increasing effective area reduces average face velocity, provided air can reach that area without excessive obstruction.
More pleats do not automatically create more effective area. Closely packed pleats can restrict channels, increase local velocity, and prevent uniform use of the media.
Media thickness and stiffness influence achievable pleat spacing. A construction with attractive flat sheet resistance may require geometry changes that reduce its expected assembly advantage.
Pleat deformation under airflow can further narrow channels or cause adjacent surfaces to touch. Support design and material stability therefore affect restriction during actual operation.
Seals, end caps, inlet transitions, and housing passages introduce additional losses. These should be considered when attributing a finished filter’s restriction to its media.
Use flat sheet testing to screen materials, then compare representative elements in controlled geometry. Record any geometry changes needed to accommodate each candidate material.
What should a reliable technical comparison include?
Start by defining engine airflow requirements, the allowable clean element restriction, the terminal restriction limit, and the filtration performance needed for the intended operating environment.
Keep test area, face velocity, air conditions, specimen conditioning, and mounting arrangements consistent. Check that edge sealing prevents bypass without distorting the exposed material.
Evaluate several specimens and, where practical, multiple production lots. An average value alone can conceal variation that becomes important near a design acceptance limit.
Measure initial efficiency alongside clean pressure drop, using a defined aerosol or dust and an appropriate method. Include particle size information where protection requirements demand it.
Continue testing through dust loading to observe efficiency changes, restriction growth, and capacity. Apply the same dust, concentration, airflow, and endpoint to each candidate.
ISO 5011 provides relevant procedures for engine air cleaner performance testing. Specify the applicable procedure and configuration rather than assuming every reported result is directly comparable.
For media screening, use suitable documented methods and connect their results to complete element validation. Report deviations clearly so reviewers can assess their significance.
A practical comparison sheet should combine clean resistance, efficiency, loading behavior, mechanical properties, and variability. This makes tradeoffs visible before procurement decisions become fixed.
How should technical evaluators assess supplier capabilities?
Ask suppliers which formulation and process variables they can control consistently. Useful answers connect manufacturing adjustments to measured changes in permeability, efficiency, strength, and durability.
Hangzhou Chaocai Materials Co., Ltd. develops functional advanced materials using fully synthetic wet-laid production and multiple lamination platforms, supporting discussions about tailored filtration constructions.
For an engine intake project, those capabilities should translate into application-specific samples, documented test conditions, and evidence of consistency across the proposed production specification.
Experience in adjacent filtration fields can inform material development, but each application still requires its own validation against the relevant fluid, environment, and performance requirements.
For projects involving vehicle cooling or hydraulic circuits, the company’s New Energy Liquid Filtration Solutions address a separate set of fluid filtration needs.
That offering emphasizes graded impurity interception, fine filtration, gas-liquid separation, and formulations designed for hydrolysis and oil resistance in relevant new energy fluid applications.
Its gradient design illustrates the broader objective of balancing capture and flow. Engine intake suitability, however, must be established through air filtration testing and qualification.
Select for the full restriction budget and protection requirement
The strongest Engine Air Intake Filter Media candidate meets the required efficiency while maintaining acceptable initial restriction, predictable loading behavior, and sufficient durability after conversion.
Begin with controlled media comparisons, then validate representative finished elements. This sequence helps identify whether a restriction problem originates in material structure or assembly geometry.
Prioritize evidence that connects clean airflow performance with protection throughout the intended service interval. A modest initial advantage may disappear if restriction rises rapidly during loading.
Select against a documented operating envelope and acceptance criteria. That approach makes lower restriction a meaningful engineering benefit while preserving the engine protection the filter must deliver.