




How humidity affects pressure drop in microglass filter media
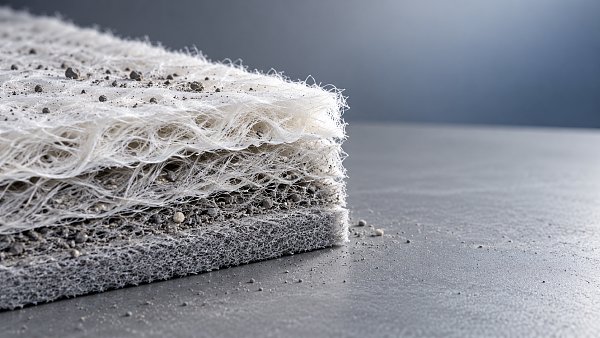
Humidity raises the pressure drop across Microglass Filter Media most strongly when it creates liquid water within the fiber network or changes the deposits already captured there. Exposure to water vapor alone does not establish how much resistance will increase. At a fixed airflow, the result depends on media temperature, surface wetting, binder chemistry, particle composition, and the ability of accumulated water to drain or evaporate.
A dry pressure-drop value therefore provides only a baseline. Reliable comparison requires separate evidence for noncondensing humidity, condensation, and incoming droplets. These conditions produce different loading mechanisms, and combining them under a single “high-humidity” rating hides information needed to interpret performance.
Relative humidity does not describe the water load
Relative humidity expresses how close air is to saturation at its current temperature. It does not directly measure water retained in a filter. Air with high relative humidity can pass through media without forming bulk liquid when the fibers remain above the local dew point. Conversely, a cold filter exposed to warmer, moisture-bearing air can collect condensate even when the upstream air is below saturation.
This distinction matters during cold starts, shutdowns, and rapid changes in intake conditions. A humidity sensor located upstream may show acceptable conditions while the media, frame, or housing remains cold enough for condensation. Measurements of inlet temperature and humidity need to be paired with temperatures near the filter surface.
Fog and entrained droplets introduce a separate water source. They arrive as liquid and do not require condensation inside the filter. A humidity chamber without droplet generation cannot reproduce this exposure simply by increasing its relative-humidity setpoint.
Moisture also changes air properties. At equal temperature and pressure, adding water vapor changes gas density and viscosity, but these effects alone generally do not explain a large resistance increase in otherwise unchanged media. Airflow reporting remains important: constant actual volumetric flow, constant mass flow, and flow normalized to reference conditions are different test conditions.
Where the extra resistance develops
For predominantly viscous flow through a clean porous sheet, pressure drop can be approximated by Δp = μLU/k, where μ is dynamic viscosity, L is media thickness, U is face velocity, and k is permeability. Wetting primarily affects the permeability term by reducing the connected space available for airflow. The relationship becomes more complicated when liquid distribution, media deformation, or inertial effects change during exposure.
Liquid films on fibers narrow flow passages. Water bridges between neighboring fibers obstruct additional paths, forcing air through the remaining open regions at higher local velocity. Uneven wetting can therefore produce a substantial resistance increase before the entire sheet appears saturated.
Glass fibers themselves do not swell like moisture-sensitive organic fibers. However, “microglass media” describes a composite structure rather than glass alone. Binders, surface treatments, supporting layers, and lamination interfaces can control its response to humidity. Moisture absorption in a susceptible binder can soften fiber junctions or alter pore geometry. Under differential pressure, reduced stiffness can also permit compaction or distortion.
A water-repellent treatment can delay surface wetting, but a water-repellency measurement does not establish airflow resistance under sustained fog exposure. Droplet size, impact velocity, defects, and accumulated contamination all influence whether water remains on the surface, penetrates the sheet, or drains away.
Loaded media can behave very differently from clean media
Hygroscopic deposits frequently explain a humidity response that clean-sheet testing misses. Salt-containing particles absorb moisture as humidity rises. Above a composition-dependent deliquescence threshold, a crystalline deposit can become an aqueous solution. The resulting droplets or liquid bridges occupy pore space and change the structure of the collected layer.
There is no universal humidity threshold for this transition. Mixed salts, soluble process residues, and contamination from other sources behave differently. A result obtained with dry, relatively nonhygroscopic test dust cannot establish resistance behavior for an intake exposed to marine aerosols or soluble industrial particles.
Drying does not necessarily reverse the process along the same path. Dissolved material can remain liquid below the humidity at which it first deliquesced, then crystallize as conditions become drier. Redistribution during wetting and drying can leave deposits concentrated at constrictions or bonded into a denser layer. Pressure drop may therefore remain elevated after the original humidity has returned.
Oil mist adds another complication. An existing oil film changes surface wetting and particle adhesion, so water exposure of oil-loaded media cannot be inferred from water exposure of a clean sample. Where mixed aerosols are relevant, the loading sequence should reproduce whether oil, dust, or moisture reaches the media first.
A humidity test needs a defined operating path
A useful test records the route from the initial dry condition through moisture exposure and subsequent recovery. A single pressure-drop reading at high relative humidity cannot distinguish a temporary response from progressive water accumulation or permanent structural change.
Begin with specimens conditioned to a defined temperature and humidity, then establish pressure drop at the intended face velocity. Exposed area, thickness, support arrangement, and airflow direction must remain consistent. For a material comparison, equal face velocity is essential; equal total airflow through unequal specimen areas creates a misleading ranking.
The exposure program should separate the following conditions:
- Noncondensing humidity: increase humidity while keeping the specimen above dew point. Hold each condition long enough to identify stabilization or continuing drift, and record the actual temperature and humidity near the sample.
- A controlled condensation event: establish a defined temperature difference that brings the specimen below dew point. Record its duration and the resulting water accumulation where measurement is feasible.
- Liquid aerosol exposure: specify droplet characteristics and water delivery rate. Include the mounting orientation and drainage arrangement because both affect retained water.
- Recovery: return to the initial conditions and follow pressure drop until it stabilizes. Repeat a wetting cycle if repeated exposure represents service conditions.
Separate specimens can isolate individual mechanisms. A sequential test is useful when the sequence itself represents operation, but later stages then reflect the history of earlier exposure. That history belongs in the report.
Pressure sensing also needs protection from the test environment. Condensation in tubing or a wet pressure tap can distort differential-pressure readings. Water on a specimen holder or support screen can add resistance that is incorrectly attributed to the media. Fixture characterization and inspection help identify these effects.
Read pressure drop alongside flow, efficiency, and recovery
Under constant-flow control, increasing resistance appears as a higher pressure drop. In a fixed-speed fan system, increasing resistance shifts the operating point and reduces airflow; the measured differential pressure follows the interaction between the fan and system curves. A modest pressure reading therefore does not establish stable performance unless airflow is also known.
Compare wet and dry results at the same actual face velocity, or use measured flow-resistance curves to make the comparison. Record any temperature or reference-condition corrections explicitly. Otherwise, a change in flow can be mistaken for a change in permeability.
Useful results include the initial dry resistance, the peak during exposure, the resistance under sustained wet conditions, and the residual resistance after reconditioning. The time required to recover also matters where humid events recur before the media dries. A sheet that recovers after prolonged laboratory drying may still accumulate water during repeated short operating cycles.
Filtration efficiency should accompany resistance measurements where moisture could affect integrity. A falling pressure drop can indicate improved drainage, but it can also result from a tear, delamination, or leakage around the specimen. Pressure-drop recovery alone cannot demonstrate that the filtration structure survived the exposure.
Wet mass measurements provide supporting evidence, although handling time must be controlled because evaporation begins immediately. If collection efficiency is measured with hygroscopic challenge particles, humidity can change their size before they reach the filter. Particle conditioning and measurement location then become part of interpreting the efficiency result.
Material specifications need to connect with the finished filter
Fiber diameter distribution, sheet density, thickness, binder content, and surface treatment influence both dry permeability and liquid retention. A more open structure can offer lower initial resistance, while its behavior under water loading still depends on pore connectivity and drainage. No single material parameter establishes the best humidity response.
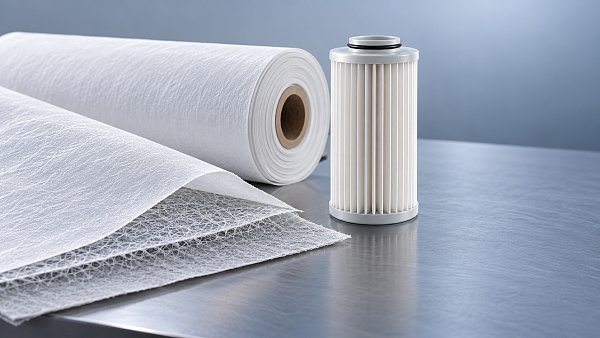
Composite construction introduces further variables. A supporting layer or adhesive pattern can restrict drainage locally, and interfaces can retain water even when the individual layers appear water resistant. Testing the complete laminate is necessary when that laminate forms the working filtration barrier.
For example, MF140400 is described with non-adhesive micro glass fibers and PBT meltblown, with liquid filtration identified as a core function. That description does not establish humid-air pressure drop or resistance to condensation. Any assessment for a gas intake application requires measurements on the intended construction under the relevant airflow and moisture conditions; liquid-filtration capability cannot substitute for those measurements.
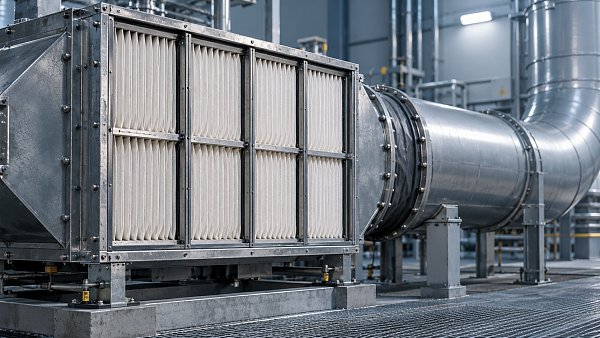
Pleating changes the relationship between a sheet test and an installed element. Narrow pleat channels can retain droplets or wet deposits, while loss of stiffness can allow neighboring pleats to approach each other. The effective flow area then decreases even if the material’s local permeability changes little. Pleat spacing, support design, orientation, and drainage paths must therefore be represented in element-level testing.
What a usable humidity-performance report establishes
A report suitable for comparison identifies the complete media construction, specimen conditioning, face velocity, temperature history, and moisture exposure method. It also describes particle loading, exposure duration, drainage conditions, and the criterion used to declare stabilization. A standard reference is useful only when its scope and reported procedure cover the behavior being evaluated; a dry efficiency classification alone does not establish humid-service resistance.
Acceptance limits should connect the measured response to available system pressure and required airflow. A temporary resistance peak, continuing upward drift, and persistent residual increase have different operational consequences. The report should preserve those distinctions rather than compressing the entire exposure into one average value.
When pressure drop continues rising through repeated humidity cycles, extending the test can reveal whether water retention reaches equilibrium or deposits progressively restructure. That distinction determines whether a short exposure result represents a stable operating condition or only an early stage of deterioration.
Recommendation
 Oct 30, 2026
How Can Air Filter Media Hold More Dust Without Increasing Pressure Drop?
Explore Ltd. filter media lead time and discover how depth loading, layered media, and pleat design can increase dust capacity while controlling pressure drop.- Oct 30, 2026
How to Evaluate an ePTFE Laminated Filter Media Supplier
Explore Ltd. moisture resistant media and learn how to evaluate ePTFE laminated filter suppliers for performance, consistency and long-term value. - Oct 30, 2026
Is F9 Filter Media Suitable for Gas Turbine Air Intakes?
Explore Ltd. custom filter media options for gas turbine air intakes, and learn how F9 performance, pressure drop, and site conditions guide your choice.